A Guide to IT Configuration Data Management
IT Service Management (ITSM) and Configuration Management Databases (CMDB) have been around for a long time and most companies have been loading them with configuration data for years. But how much value are you really receiving from the data you are amassing? Is your IT configuration data only giving you pretty pictures or is it generating actionable insights?
The purpose of IT configuration management and IT data management in general is providing trustworthy insights that enable informed decision making. It’s not about how much data you have, it’s about what you use it for.
IT configuration data is essentially a raw material that needs to be refined and combined with other things to be transformed into understandable information and actionable insights. Like most raw materials, their real value isn’t exposed until the transformation is complete.
Discovery
IT Discovery tools are great! They enable you to collect data about your IT environment from various points of view focusing on different layers in the technology stack.
When you combine discovery data with reference data and master data from other sources, you probably have most of the pieces to assemble a wholesome picture of your environment, its components, and how they fit together. The more pieces available to work with, the more complete your puzzle is likely to be when assembled.
Data Aggregation
Once you’ve collected data from different sources, that is where your CMDB comes into the picture – providing a place where you can begin to bring the pieces together and connect them together.
IT configuration data is really nothing more than lists of data and dependencies mapped between them i.e. the Configuration Items (CI) and relationships.
IT Discovery is usually pretty good about providing updates to the lists of data, but relationships are a bit more difficult. The dependency data derived from different discovery sources can often have gaps and overlaps that need to be reconciled in the CMDB to make the overall picture accurate.
Data Visualization
After some aggregation and refinement in the CMDB, your IT configuration data picture should be starting to take shape – but depending on how you are trying to view it, it might be pretty confusing. That is because the data in your CMDB is a simplified representation in text form of your IT environment which started out as a picture.
In order to see the picture that your IT configuration data is portraying, you need to get it back into a visual form. Most reporting and analytic solutions that provide data visualization are really focused on depicting summarized data – graphs and trends.
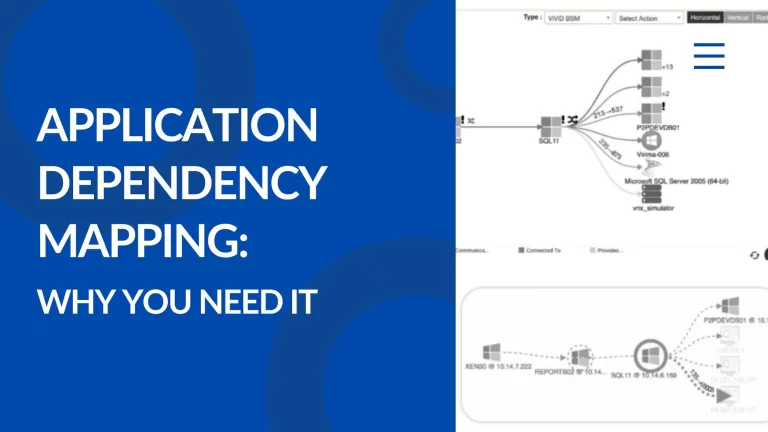
Understanding your IT environment requires visualizing the detailed underlying data in a way you can easily understand.
Data visualization capabilities like Virima can help with that by turning your raw CMDB data – configuration items and relationships – back into the picture the data depicts.
Drawing Actionable Insights
Simply visualizing the data in your CMDB isn’t enough unless your end goal is simply creating some pretty pictures and artwork.
For most companies, the reason they invest in IT configuration data is not to create art, it is to create information and drive decisions. This requires the ability to take the big picture of your IT environment, zoom in on the area you are interested in, filter out the stuff you don’t need, and focus on the information that is meaningful.
If you have the right tools to do this effectively, the information that you see will provide you with insights about what is working well and where there are areas needing attention.
These are the actionable insights that decision makers are looking for. In order to get there, you not only need the raw materials, but you need the right tools to help you with the refinement process.
Virima: An Experienced IT Specialist
That is Virima’s specialty – providing the IT discovery tools, CMDB and visualization capabilities to manage the end-to-end process of turning your IT configuration data into insights that drive value for your company.
Why not see for yourself? Run Virima Discovery free for 60 days in a data center of your choice and see how insightful a fully visualized CMDB can really be. To learn more, sign up here.
Virima features can automatically discover and map your critical IT resources and the interconnections that link them to one another, your applications and services, and your users.
Virima is here to help. To get started, contact us today to schedule a demo and explore the possibilities!