Service Mapping Trends in 2026: What’s Changing and What to Prioritize
The service mapping trends shaping 2026 share a common thread: IT teams want a living view of how their services connect, not a static diagram that goes stale the moment infrastructure changes. As environments spread across data centers, AWS, and Azure, knowing which assets support which business service has become a daily operational need rather than a documentation exercise.
The pressure shows up in outage data. The Uptime Institute’s 2025 Annual Outage Analysis found that IT and networking issues climbed to 23% of impactful outages in 2024, a rise the report links to growing IT and network complexity that drives change management problems and misconfigurations (Uptime Institute, 2025). When you cannot see how a service is wired together, every change carries hidden risk.
This guide walks through the service mapping trends that matter most this year, how the discipline has shifted since the early dependency-mapping era, and what to prioritize when you evaluate tools. If you are new to the topic, our overview of the business benefits of service mapping is a useful starting point.
How service mapping trends shifted from static maps to discovery-driven data
A decade ago, dependency maps were built largely by hand and updated on a schedule that rarely kept pace with change. That approach left gaps, and people lost faith in maps that drifted out of date. Today the most useful service maps are discovery-driven: they are built from data your discovery process already collects across networks, servers, and cloud accounts, then refreshed as that data changes.
Instead of relying on constant brute-force scanning, modern tools take a demand-driven approach, refreshing a map when the underlying data shows signs of drifting out of date. Virima supports this through high-frequency discovery cycles across AWS and Azure environments alongside on-premises infrastructure, so the picture stays close to current without scanning everything every hour for its own sake.
Service maps and the CMDB keep converging
One of the clearest service mapping trends this year is the tightening link between service maps and the configuration management database. A map is only as trustworthy as the configuration data beneath it, so teams are treating the two as one discipline rather than separate projects. Pairing ViVID Service Mapping with a well-maintained CMDB gives change and incident teams a shared, current source of relationships to work from. For a closer look at where this fits operationally, see why service mapping is central to a sound change management plan.
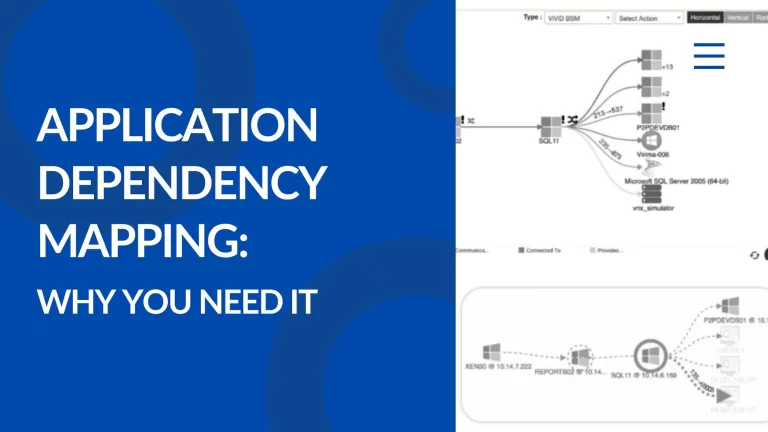
Application dependency mapping moves to the foreground
Application Discovery and Dependency Mapping has matured from a niche capability into a core requirement, especially as workloads span on-premises systems and multiple cloud accounts. The trends here favor tools that surface transaction-level and application-to-application relationships, not just host-to-host links, because that is where most modern outages actually originate. For a current view of the category and how vendors compare, see our roundup of the top application dependency mapping tools for 2026.
Service maps move closer to change and incident workflows
Another of the service mapping trends worth watching is how maps are being pulled directly into change and incident work rather than living in a separate tool. Change managers increasingly want to assess the likely impact of a change before they approve it, and incident responders want to trace a fault to its dependencies while the clock is running.
With ITSM integration, a service map can also surface pending changes on related assets, helping teams spot collisions before they happen. Virima offers bidirectional sync with popular ITSM platforms, including ServiceNow, Ivanti, Halo, Jira Service Management, and Xurrent, so the map and the workflow stay connected.
What these service mapping trends mean for the data you trust
Across all of these service mapping trends, one principle holds: a map is only useful if you trust the data behind it and know where it came from. That means confidence in the data, a refresh when the data starts to age, and clear attribution for where each detail originated.
This is the idea behind what Virima calls trusted runtime truth. Rather than scanning around the clock, it extends the service map rescan that teams already rely on, refreshing details on demand so both people and AI-assisted tools can act on current, sourced data instead of guessing. You can read more about that approach on the trusted runtime truth page.
| See how ViVID builds these maps from your own discovery data. Request a demo. |
ViVID™ Service Mapping: putting the 2026 trends to work
ViVID™ (Virima Visual Impact Display) Service Mapping builds dynamic dependency maps from your discovery data, showing ownership, linked incidents, linked vulnerabilities, and change risk in a single visual layer. Change managers use it to weigh the impact of a change before approving it. Incident responders use it to trace root cause faster during an outage. Security analysts use it to prioritize remediation based on business-service impact, and compliance teams use it to show clear evidence of asset relationships when an audit lands.
Because the maps are built from your own discovery data and tied to the CMDB, they reflect your environment as it is, not as it looked the last time someone updated a diagram by hand.
Turning service mapping trends into everyday operational confidence
The service mapping trends of 2026 point in one direction: away from static pictures and toward living, discovery-driven maps tied to the data and workflows your team already uses. The teams that benefit most are not chasing the newest feature; they are making sure the connections they depend on are visible, owned, and current before a change or an incident forces the question. That is where a service map earns its keep.
| See what a live, owned dependency map looks like for your environment. Request a demo. |