How IT Visibility can improve network performance and reliability
Network performance depends on knowing what’s actually running in your infrastructure. A monitoring dashboard shows you metrics. But IT visibility answers the harder questions. Which devices exist? How do they connect? And what breaks when one of them fails? That foundation comes from discovery data about your assets and how they depend on each other. With it, your team can diagnose incidents faster, prevent change-related outages, and base network decisions on trusted runtime truth instead of stale records.
What IT visibility actually means
IT visibility means you can monitor, analyze, and understand the parts of your IT infrastructure. That includes the components, their configurations, and how they relate. Most definitions stop at “monitoring.” And that’s exactly the gap.
Monitoring tells you when something breaks. IT visibility goes further. It tells you what broke, what depends on it, and who owns the affected services. This matters for network performance, because most incidents don’t show up as a clean “switch failure.” Instead, they appear as slow apps, user complaints, or alerts pointing in five directions at once.
A solid network monitoring strategy gives your team real-time metric alerts. IT visibility adds the context behind those alerts. Without that context, even strong engineers can lose hours on a problem. Often, that problem took just 20 minutes to create. That’s because nothing in the alerting stack tells them which CI caused it, which services sit downstream, or what changed recently.
IT visibility improves network performance by giving your team an accurate, discovery-based view of the devices, applications, and dependencies in your infrastructure. When you can see what exists, how it connects, and which services depend on each network segment, you isolate the true root cause of slowdowns instead of chasing symptoms across disconnected dashboards.
The real root causes of network performance problems
Network engineers learn to think about hardware first. They look at failing switches, saturated links, or misconfigured routers. Those failures do happen. But many network performance problems trace back to something less obvious. Usually, it’s a change that didn’t account for what depended on it.
In fact, Gartner has long estimated that 80% of unplanned downtime comes from people and process issues, not technology faults alone. Change management gaps drive much of that. For example, a team might modify a network segment, update a firewall rule, or retire a device. Too often, they can’t see the full downstream impact. As a result, a change that took minutes to make can take hours to untangle.
Incomplete or outdated CMDB data makes this worse. Say your engineers open a configuration management database that nobody has updated since the last manual audit. Now they’re working from a map that no longer matches reality. To keep that data current, see our guide to CMDB best practices.
Other contributors to poor network performance include:
- Latency from undocumented traffic paths that bypass intended routing
- Bottlenecks at devices not flagged as critical because ownership records are stale
- Congestion from unaccounted workloads on network segments not mapped to any service
From monitoring alerts to infrastructure context
Monitoring platforms watch your metrics and fire alerts when they cross a threshold. But there’s usually a gap between “alert fired” and “incident fixed.” And that gap has less to do with the tool. Mostly, it comes down to the infrastructure knowledge your team needs to act.
IT discovery fills that gap. It runs high-frequency discovery cycles across your connected devices, applications, virtual machines, and services. Each cycle updates the CMDB with current, accurate data. So when an alert fires, your engineers open the CI record right away. They see its owner, its recent changes, and its service dependencies. As a result, work that used to take hours becomes a decision that takes minutes. And network performance recovers before users feel the worst of it.
This is also where your choice between active vs. passive IT asset discovery matters.
Active and passive discovery build your asset inventory in different ways. Active discovery scans network devices directly to capture their configuration and state. Passive discovery watches network traffic to spot what’s communicating, without probing devices. Most teams use both: active scans for solid configuration data, and passive observation to catch the assets those scans miss.
The right mix depends on your environment. Still, the goal stays the same. You want a current, reliable inventory that shows what you’ve actually deployed.
Dependency mapping and blast radius
The biggest performance gain comes when discovery data feeds your service dependency mapping. Virima’s ViVID™ service maps layer service context on top of the discovered inventory. Then you can answer one key question before any change or incident: if this network component fails or changes, which services and users feel it?
Blast radius, in network operations, is the full set of services, applications, and users affected when a single configuration item fails or changes.
Now you can answer that question in seconds, instead of finding out the hard way. That changes how your team handles incidents. For example, engineers can check blast radius before they approve a change window. And they can scope a failing switch by reading the map — not by calling every app owner and waiting for replies.
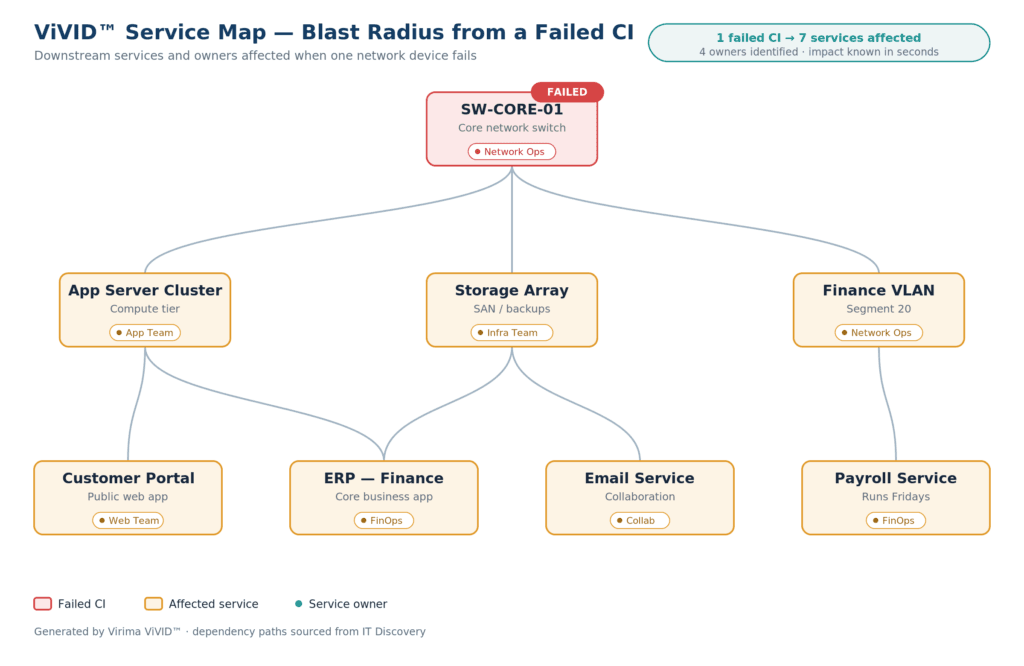
Service dependency mapping turns network topology data into clear service context. When a network switch fails, the map instantly shows which applications, services, and business processes sit downstream. Virima’s ViVID™ service maps are built from discovery data. So they give your team a visual impact view that lowers mean time to resolution and stops disruptions from cascading.
IT visibility vs. observability: understanding the difference
People often use the terms IT visibility and observability as if they mean the same thing. But they solve different problems.
Observability platforms track real-time metrics, logs, and traces from running systems. They reveal performance trends, anomaly spikes, and root-cause signals from live telemetry. IT visibility, on the other hand, builds the reliable record of what exists. That record covers your assets, configurations, service dependencies, ownership, and change history. Without IT infrastructure visibility, observability alerts tell you something is wrong — but not which CI caused it, which service it hits, or who handles it next.
IT visibility and observability solve different problems. Observability tracks real-time metrics, logs, and traces from running systems. IT visibility builds the reliable record of what exists: your assets, configurations, service dependencies, and ownership. Without IT visibility, observability alerts tell you something is wrong, but not which CI caused it, which service it hits, or who to escalate to.
The two work best together. In fact, observability shines only when the infrastructure context beneath it is accurate. So if you invest in observability tools but skip accurate discovery and CMDB data, you build signal on top of noise. And your network performance reporting inherits every gap in that data.
Network reliability requires more than uptime monitoring
Network reliability is your network’s ability to deliver data and services without disruption. Uptime monitoring only shows whether the network is up. But sustained network performance means knowing why it would go down in the first place.
Discovery-sourced IT visibility helps you spot failure points before they cause incidents. When your inventory is current and your dependency map is accurate, your team can:
- Spot devices approaching end of support and plan replacements before they become risks
- Identify configuration drift on network CIs before it causes unexpected behavior
- Understand which network segments carry critical services, so redundancy investments go to the right places
Most IT teams know they need redundancy. Far fewer know exactly where their real single points of failure sit. That’s because the network map in the CMDB rarely matches what’s actually deployed. Discovery closes that gap. For a deeper look, read our post on the challenges of achieving IT visibility in complex environments.
Network reliability starts with knowing what your infrastructure actually looks like today, not what the docs said six months ago. A CMDB fed by high-frequency discovery cycles stays current. It flags new devices, unauthorized connections, and dependency changes as they happen. So teams working from an accurate CMDB resolve network incidents faster and prevent more of them.
See how Virima delivers Trusted Runtime Truth for IT operations → virima.com/trusted-runtime-truth
The real cost of network downtime
The cost of network downtime varies by industry, but the scale stays consistent. For example, a widely cited 2014 Gartner study put the average cost of IT downtime at $5,600 per minute. Later, the 2016 Ponemon Institute and Emerson Network Power study placed the average data center outage closer to $8,851 per minute once you include indirect costs. Both figures are several years old. And for financial services, healthcare, or e-commerce, they likely understate today’s real impact.
Direct revenue loss is only part of the story. Every minute of degraded network performance adds secondary costs too. Think overtime to fix the incident, reputational damage with users, possible SLA penalties, and compliance risk if your audit trails have gaps. The shorter the incident, the smaller each of these costs. And the incident stays short when your team has accurate infrastructure context the moment the alert fires.
EMA’s 2025 ServiceOps research — which Virima sponsored — points to discovery quality and CMDB maturity as key factors. They shape how fast you resolve major incidents and how often those incidents return. In short, investing in IT visibility measurably improves network performance and reliability. It’s not just an operational preference.
How Virima builds IT visibility from discovery data
Virima brings together its IT Discovery engine, CMDB management, and ViVID™ service maps in one platform. Together, they give your IT operations team trusted runtime truth about the network. You don’t just get monitoring alerts. You get a live picture of what exists, how it connects, and what a change will break.
Virima IT Discovery runs high-frequency discovery cycles across your connected devices, applications, and virtual machines. It works across on-premises, hybrid, and cloud environments. Every asset it finds updates the CMDB with configuration state, ownership data, and change history. As a result, you get a model that reflects what’s actually deployed — not what someone wrote down at the last audit. That’s the foundation of reliable CMDB network visibility.
ViVID™ service maps build on that inventory to show your service dependencies visually. First, you provide service definitions by hand, through a spreadsheet import, or through integrations with platforms like ServiceNow, Jira, or Ivanti. Then Virima generates maps that show how each network component connects to the services that rely on it.
So when a network incident hits, your team won’t guess at the service impact. Instead, they read it straight from a map built on trusted runtime truth. And they act on network performance issues with context, not guesswork.
Your IT team gains network change visibility when discovery data, CMDB records, and service dependency maps share one source. Virima IT Discovery fills the CMDB from direct device data. Then ViVID™ service maps turn it into service-impact context. Together, they show the impact picture you need before a change is approved and after an incident fires.
The outcomes translate directly to network performance and reliability:
| Capability | Network performance outcome |
|---|---|
| Discovery-based CMDB | Engineers start incident diagnosis with full infrastructure context, not empty alert queues |
| ViVID™ service maps | Service impact analysis becomes a standard pre-change step, reducing change-related outages |
| Ownership and change history | Fewer repeat incidents because root cause addresses the CI, not just the symptom |
| Current asset inventory | Accurate capacity planning built on real utilization data, not outdated records |
New to mapping infrastructure risk? Read the challenges of achieving IT visibility in complex environments to see where most teams’ network performance data breaks down first.
Frequently asked questions
What causes most network performance problems in enterprise IT?
Most network performance problems start with change, not hardware. Often, a change doesn’t account for downstream dependencies. Configuration drift on network CIs adds to it. So does asset data that no longer matches the current network. Hardware does fail. But change gaps and stale CMDB data cause more incidents than most teams expect.
How does IT visibility differ from network performance monitoring?
Network performance monitoring tracks real-time metrics like bandwidth, latency, and packet loss. IT visibility gives those metrics the context they need. It shows which devices exist, how they’re configured, which services depend on them, and what changed. In short, monitoring generates the signal. IT visibility gives you the context to act on it.
Can IT visibility reduce network downtime?
Yes. When your team has an accurate inventory, current dependency maps, and full change history, you diagnose incidents faster. You also prevent more of them before they cause downtime. High-frequency discovery cycles keep that context current. So the picture your engineers work from reflects what’s actually deployed, not what someone last documented by hand.
How can IT teams reduce mean time to resolution (MTTR) for network incidents?
You reduce MTTR by starting diagnosis with full context, not an empty alert queue. A discovery-sourced CMDB shows the affected CI’s owner, recent changes, and downstream dependencies the moment an alert fires. So your engineers skip the discovery step and move straight to the fix. That turns hours of investigation into a decision made in minutes.
How does Virima help IT teams improve network reliability?
Virima fills a CMDB with discovery-sourced data. Then it builds ViVID™ service maps that show how network components connect to your IT services. Now your team sees service impact, ownership, and configuration state clearly. With that context, you prevent change-related outages, scope incidents accurately, and resolve them faster. Learn more about Virima’s Trusted Runtime Truth approach.
IT visibility builds the foundation for real network performance management. Monitoring tools spot symptoms. Discovery-based context finds the causes. So when both work from the same data, your team spends less time debugging and more time preventing.
Ready to see it on your own network? Schedule a demo →